Carbon monoxide concentrations,2006
Numéro d’image : 11749847
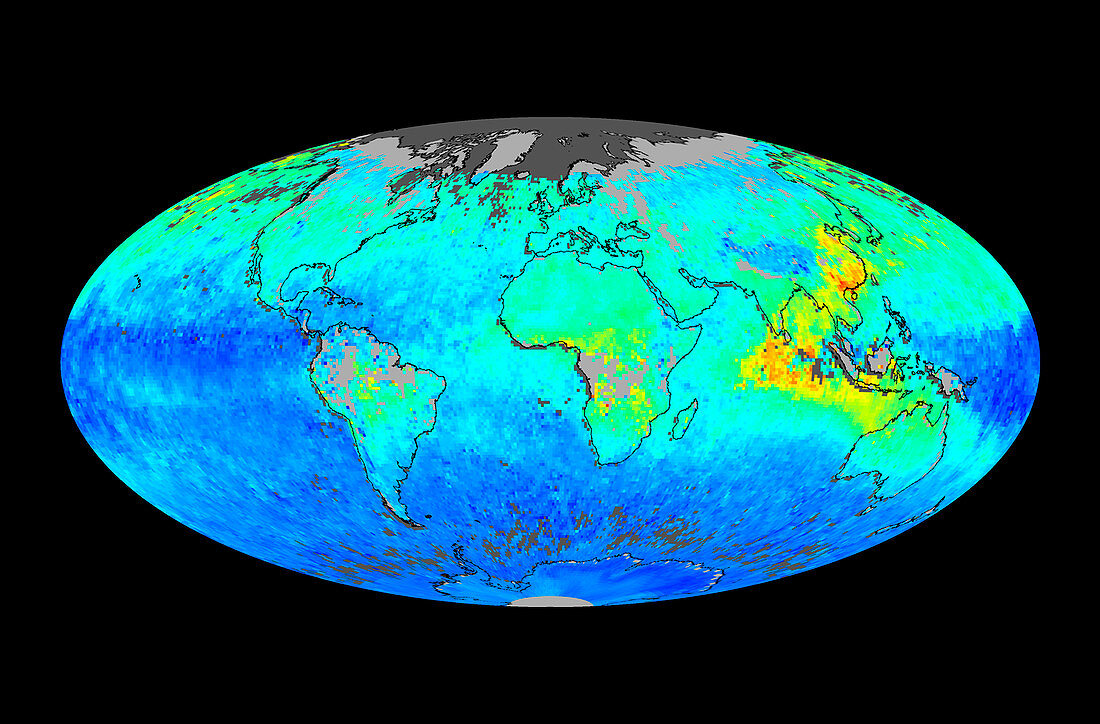
| Global carbon monoxide concentrations,November 2006. Satellite image showing the concentration of carbon monoxide (CO) in the atmosphere at an altitude of 3 kilometres. CO is measured in parts per billion and ranges from very little CO (blue),average (green,150) to high (red,300). Areas of grey are where data could not be collected. The source of high levels of CO is the burning of land due to wildfire or deliberate land clearance. 2006 was an El Nino year,and the increase in wildfires and associated CO levels over Indonesia and Sumatra (right) has been linked to the increased drought conditions of this year. This map may be compared to one from the previous year,which was not an El Nino year. To see this map see E180/463. The map was created using data collected by the Measurements of Pollution in the Troposphere (MOPITT) sensor on the Terra satellite | |
| Licence : | Droits gérés |
| Crédit: | Science Photo Library / NCAR / NASA |
| Taille de l’image : | 4488 px × 2953 px |
| Model Release : | Non requis |
| Property Release : | Non requis |
| Restrictions : | - |
Prix pour cette image À partir de 45 €
Produit vendu
(Calendrier, Carte postale, Carte de vœux, Impression sur textile, Packaging etc)
À partir de 45 €
Usage commercial
(Affichage, Annonce presse, Annonce TV, Carte, Digital - hors rés. sociaux, Digital - rés. sociaux etc)
À partir de 45 €
Éditorial
(Digital, Journal, Livre, Livre pratique, Magazine, Télévision etc)
À partir de 60 €
Usage non-commercial
(Digital - hors rés. sociaux, Digital - rés. sociaux etc)
À partir de 120 €
Mots clés
- 2006,
- 21ème siècle,
- atmosphère,
- carte,
- chimie atmosphérique,
- climat,
- climatologie,
- climatologique,
- concentration,
- concentrations,
- de l'espace,
- distribution,
- EL NINO,
- feu de forêt,
- image satellite,
- météo,
- météorologie,
- météorologique,
- monoxyde de carbone,
- niveaux,
- novembre,
- planète,
- satellite,
- science de la terre,
- sciences,
- sciences de l'environnement,
- sciences environnementales,
- sécheresse,
- spatial,
- terra,
- terre,
- terrien,
- XX1ème siècle