Met Office global warming model 2CO2 atmosphere
Numéro d’image : 11736323
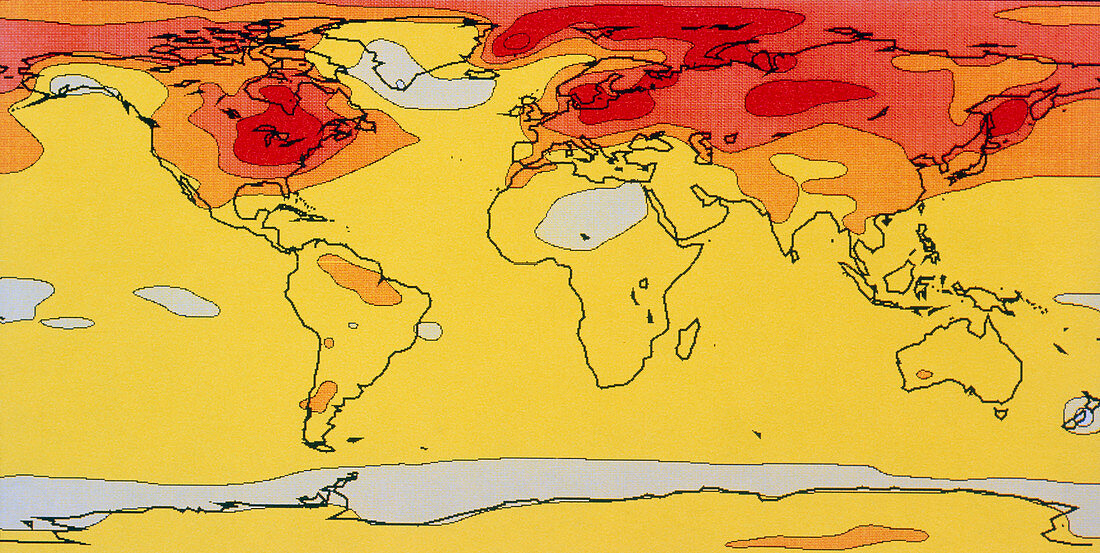
| Global warming model. Computer-generated map of the world showing the effect of carbon dioxide (CO2) on global temperatures. The map shows how much warmer surface air temperatures would be in northern winter (December to February) if the man- made CO2 load in the atmosphere were twice the present value. Temperature increases are colour- coded from pale yellow (0-2 Celsius) to red (8-12 Celsius). The model clearly predicts a dramatic warming of northern hemisphere winters,with the largest warming seen in western USA & Canada,northern Eurasia and in the Arctic circle. This is a result of the so-called 'Greenhouse Effect' | |
| Licence : | Droits gérés |
| Crédit: | Science Photo Library / UK Meteorological Office |
| Taille de l’image : | 4929 px × 2480 px |
| Model Release : | Non requis |
| Property Release : | Non requis |
| Restrictions : | - |
Prix pour cette image À partir de 45 €
Produit vendu
(Calendrier, Carte postale, Carte de vœux, Impression sur textile, Packaging etc)
À partir de 45 €
Usage commercial
(Affichage, Annonce presse, Annonce TV, Carte, Digital - hors rés. sociaux, Digital - rés. sociaux etc)
À partir de 45 €
Éditorial
(Digital, Journal, Livre, Livre pratique, Magazine, Télévision etc)
À partir de 60 €
Usage non-commercial
(Digital - hors rés. sociaux, Digital - rés. sociaux etc)
À partir de 120 €