Antarctic ice velocity map
Numéro d’image : 11723062
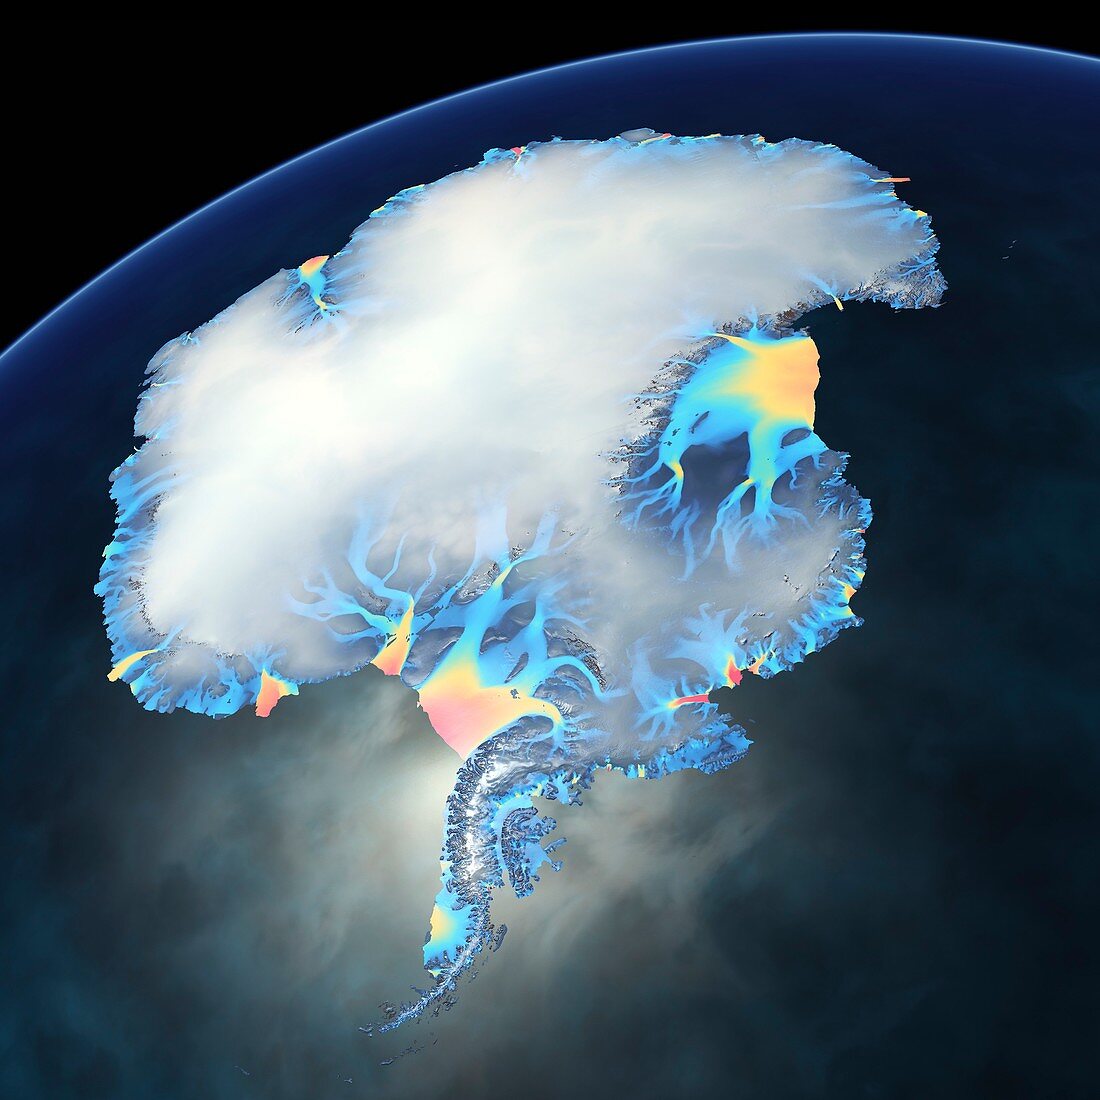
| Antarctic ice velocity map. Map showing the speed at which ice flows off the Antarctic ice sheet via glaciers. The yellow and red areas are where ice flow is fastest and ice loss is greatest. The rate of such ice flows is studied by glaciologists and climatologists researching global warming. The data was obtained by NASA satellite radar mapping (InSAR,Interferometric Synthetic Aperture Radar) in the period 2007 to 2009. The results were published in 2011 by researchers at the National Snow and Ice Data Center | |
| Licence : | Droits gérés |
| Crédit: | Science Photo Library / Pharand-Deschenes, Felix |
| Taille de l’image : | 4200 px × 4200 px |
| Model Release : | Non requis |
| Property Release : | Non requis |
| Restrictions : | - |
Prix pour cette image À partir de 45 €
Produit vendu
(Calendrier, Carte postale, Carte de vœux, Impression sur textile, Packaging etc)
À partir de 45 €
Usage commercial
(Affichage, Annonce presse, Annonce TV, Carte, Digital - hors rés. sociaux, Digital - rés. sociaux etc)
À partir de 45 €
Éditorial
(Digital, Journal, Livre, Livre pratique, Magazine, Télévision etc)
À partir de 60 €
Usage non-commercial
(Digital - hors rés. sociaux, Digital - rés. sociaux etc)
À partir de 120 €
Mots clés
- 2011,
- 21ème siècle,
- Antarctique,
- Antartica,
- aucun,
- austral,
- calotte glaciaire,
- carte satellite,
- climatologie,
- climatologique,
- continent,
- data,
- donnée,
- données satellites,
- du sud,
- ensemble de données,
- géographie,
- géographie physique,
- géographique,
- glacier,
- glaciers,
- glaciologie,
- illustration,
- NASA,
- oeuvre,
- personne,
- polaire,
- sciences de l'environnement,
- Sciences de la Terre,
- sciences environnementales,
- vitesse,
- XX1ème siècle