Three representations of a conical distribution
Numéro d’image : 11523325
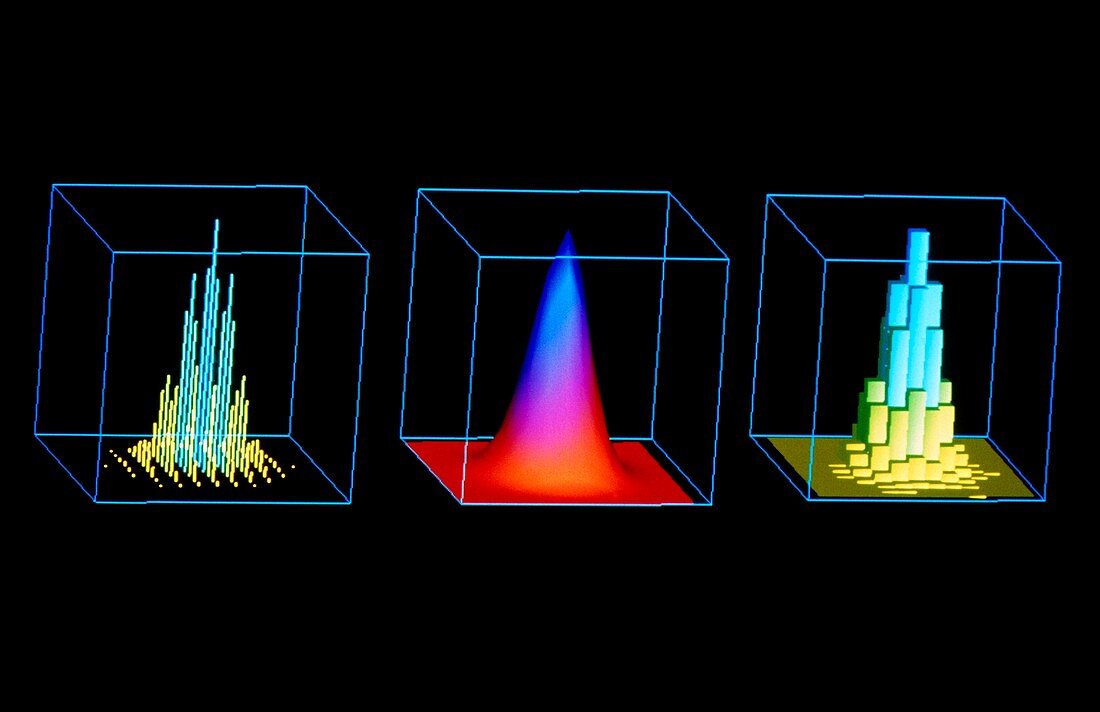
| Visualisation in mathematics: conical distribution in graphical form. Computer graphics image of three ways in which a 3D conical function may be shown graphically. At left is a simple altitude plot,where points on the surface of the cone are plotted and joined to the base (x,z surface) by vertical lines. At right the lines are replaced by histogram blocks. At centre,the points have been interpolated to produce a smooth surface | |
| Licence : | Droits gérés |
| Crédit: | Science Photo Library / Cern |
| Taille de l’image : | 5204 px × 3367 px |
| Model Release : | Non requis |
| Property Release : | Non requis |
| Restrictions : |
|
Prix pour cette image À partir de 45 €
Produit vendu
(Calendrier, Carte postale, Carte de vœux, Impression sur textile, Packaging etc)
À partir de 45 €
Usage commercial
(Affichage, Annonce presse, Annonce TV, Carte, Digital - hors rés. sociaux, Digital - rés. sociaux etc)
À partir de 45 €
Éditorial
(Digital, Journal, Livre, Livre pratique, Magazine, Télévision etc)
À partir de 60 €
Usage non-commercial
(Digital - hors rés. sociaux, Digital - rés. sociaux etc)
À partir de 120 €